How to resolve and avoid deadlocks in SQL Server databases
Deadlocks are a real hindrance to SQL Server users, but database administrators can avoid them by taking steps to limit them and stop them from recurring.
The first step in learning how to avoid deadlocks in SQL Server databases is preparedness. Knowing about deadlocks -- in particular, what causes them -- is the key to preventing them and resolving those that do occur, according to SQL Server experts.
Deadlocking isn't the same thing as blocking. The latter happens normally during database operations when a transaction tries to access a system resource that has been locked by another transaction. The SQL Server system blocks the second transaction until the first completes its process and releases the lock -- a situation that can be resolved by SQL Server itself without requiring any manual intervention.
SQL Server deadlocks, on the other hand, happen when two transactions block each other from resources they need to use, resulting in what's referred to as a deadly embrace that stops both transactions from continuing. SQL Server can automatically clear deadlocks, but only by terminating one of the transaction threads, and the intervention process to ensure that deadlocks don't recur can be lengthy and complex for database administrators (DBAs).
What causes deadlocks in databases?
Thomas LaRock, "head geek" at management tools vendor SolarWinds in Austin, Texas, wrote in a June 2016 blog post that there are four primary -- and interrelated -- causes of deadlocks in SQL Server: application code, the database schema design, the resulting access patterns and the transaction isolation level settings in a database.
Deadlocks don't only occur in databases that contain large tables with indexes, LaRock added -- they can also happen in small tables. He said databases that encounter deadlocks can be seen as performance bottlenecks by end users, which puts pressure on SQL Server DBAs and application developers to work together "to track down the root cause and fix the issue."
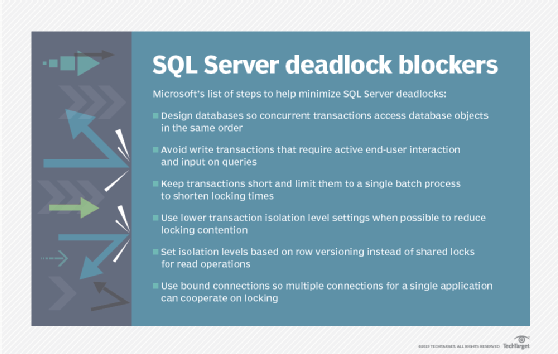
Tips from Microsoft on how to avoid SQL Server deadlocks
Ways to avoid SQL Server deadlocks
Avoiding deadlocks in SQL Server is easier said than done, but it's not an impossible task.
In a December 2017 blog post, Victor Simon, a data recovery expert at DataNumen in Hong Kong, pointed to poor database design as a common cause of deadlocks. To help minimize the deadlock risk, he said a SQL Server DBA should create a well-defined order for how concurrent transactions access database objects, along with a clear set of rules to govern the process.
DBAs should also restrict users from inputting data while a transaction is being processed, Simon said. In addition, deadlocks are sometimes created because tables are locked when users run queries against them if a database is configured with the READ COMMITTED transaction isolation level, SQL Server's default setting. Additional queries have to wait for the lock to be released, but Simon said using the NOLOCK table hint in T-SQL statements allows DBAs to override table locking.
Using bound connections is another way to help avoid deadlocks in SQL Server, Simon wrote. That enables an application to open multiple cooperative connections to a database that can work with each other on locking so they don't block each other, reducing the likelihood of problems like deadlocking and database corruption.
Deadlock removal with SQL Server's lock monitor
SQL Server comes with a lock monitor feature that can detect and end deadlocks. It periodically searches for them in a database instance. The default interval between searches is every five seconds, but Microsoft says that drops to as low as 100 milliseconds if any deadlocks are found, with the new interval varying based on the frequency of the deadlocks.
DBAs must still investigate deadlocks to determine their cause so steps can be taken to avoid them in the future.
When the lock monitor detects multiple application threads trapped in a deadlock, it selects one of them to be the deadlock victim. That thread's processing jobs are terminated, and the ongoing transaction is rolled back in the database. Doing so releases the locks held by the deadlock victim, which allows the other blocked session -- or sessions -- to resume processing.
The lock monitor, by default, determines the deadlock victim based on the rollback cost, choosing the thread that will be least expensive to roll back from a processing standpoint. DBAs can also use the SET DEADLOCK_PRIORITY statement to assign priority levels to threads in the event of deadlocks.
The session with the lowest priority will then be chosen as the deadlock victim. If multiple sessions have the same deadlock priority, the lock monitor will revert to choosing the one with the lowest rollback cost.
Info about deadlocks to help avoid them
Though it may seem more convenient to rely solely on the lock monitor to do its job, DBAs must still investigate deadlocks to determine their cause so steps can be taken to avoid them in the future. There are three primary methods of getting information about deadlocks -- known as the deadlock graph -- from SQL Server.
Using trace flag 1222 in T-SQL returns information captured in SQL Server's error log after deadlocks occur; trace flag 1204 can also be used, but 1222 provides more details. The trace flags were once the only real way to access the deadlock graph info, according to Grant Fritchey, a product evangelist at Redgate, a SQL Server tools vendor based in Cambridge, England.
To capture information on deadlocks as they occur, however, trace flag 1222 must be permanently enabled, Fritchey wrote in an article on Redgate's website. With the advent of newer, more efficient methods, he recommended only using the trace flag as a last resort to aid in deadlock prevention.
The other approaches include using the system_health session in SQL Server's built-in Extended Events performance monitoring tool to view deadlock information. Extended Events was introduced in SQL Server 2008, and Microsoft added the deadlock graph to the system_health session in SQL Server 2012. According to Microsoft's documentation, the session is enabled by default and automatically captures information about the processes and system resources involved in deadlocks, plus a list of deadlock victims.
DBAs can also use Microsoft's SQL Server Profiler tool to save deadlock graphs for viewing and analysis in SQL Server Management Studio, although the profiler is now in maintenance mode and not recommended for use with new applications. As an alternative, users can turn to third-party performance monitoring tools to help in their efforts to resolve and avoid deadlocks in SQL Server.