spatial data
What is spatial data?
Spatial data is any type of data that directly or indirectly references a specific geographical area or location. It is most commonly processed and analyzed by geographical information systems (GISes) to enable users in a wide range of industries to understand geographic context, patterns and relationships for further analysis, communications and decision-making.
Sometimes called geospatial data or geographic information, spatial data most often numerically represents a physical object (natural or manmade) in a geographic coordinate system. The system uses two-dimensional (2D) geographic coordinates known as Cartesian or x and y coordinates. However, spatial data is much more than geographic coordinates represented on a 2D map. Spatial information can also include geometric shapes like lines or polygons, descriptions of a particular geographic feature, as well as images presented in the form of rasters (a grid of pixels).
Since spatial data can contains more than location-specific data, different types of data can be saved in different formats. Capturing and analyzing spatial data provides a better understanding of how each variable in a geographic space impacts individuals, communities, populations, etc.
Spatial data might be collected by ground surveys or census studies, from land records and via satellite images, aerial photographs or Global Positioning System (GPS) receivers. Increasingly, drones and wireless sensors are also used to capture spatial data.
What are the different types of spatial data?
There are two primary kinds of spatial data: geometric data and geographic data.
Geometric data. Geometric data is mapped on a two-dimensional flat surface, such as a map or a floor plan. One famous real-world application that uses geometric data is Google Maps. Geometric geospatial data enables Google Maps to provide accurate directions from one location to another.
Geographic data. Geographic data is information mapped around a sphere, usually the Earth. It highlights the latitude and longitude of a specific object or location. A familiar example of geographic data is the data generated by the GPS, a satellite-based radio navigation system operated and maintained by the U.S. Department of Defense (DoD).
The two most common data formats used to store geospatial data are vector and raster.
Vector. Vectors such as points, lines and polygons represent the real world in a graphical format. Vector data is most commonly used to represent features or objects on Earth's surface. These objects might be natural, such as trees, or manmade, such as roads or buildings. For this reason, vector data is also known as feature data.
Lines are created by connecting points (literally, dots); connecting multiple lines forms enclosed areas or polygons. Points represent features that require a single coordinate pair to be located, such as the epicenter of an earthquake. Lines (which might not be straight, depending on the arrangement of their points) often represent roads, rivers and utility lines. Polygons represent areas with defined boundaries, such as land zones or buildings.
Vector data is usually stored in shapefiles, sometimes referred to as .shp files. Also, vector images can be resized larger or smaller without affecting image quality.
Raster. Raster information, also known as coverage data, is graphical data, usually presented in the form of bitmap images (although they can be stored in JPEG, TIFF, GIF and PNG formats as well). These images are compiled using pixels or tiny dots that form a pixel grid. Raster data is expressed as a range of values (over the pixelated grid).
Each pixel stored within a raster has some value, usually about color or tone. The pixels come together to create an image. The more pixels contained in an image and the more pixels displayed per inch, the higher its quality or sharpness. Resizing a raster image affects its quality since its pixels get stretched over a greater area.
In spatial analysis, a raster frequently refers to an orthoimage or the photos taken from aerial devices or satellites. Digital Terrain Models (DTM) and Digital Surface Models (DSM) also incorporate raster geospatial information. These models contain geospatial (raster) data about the earth's surface and its natural and artificial (man-made) features and are generated by unmanned aerial vehicle (UAV) mapping systems for a wide range of applications.
Attributes and temporal data
Spatial data might contain additional information or nonspatial data known as attributes. An attribute is usually a piece of information that describes a feature. Spatial data can have any number of attributes about a location, such as a map, photographs, historical information and so on.
By providing more information about an entity, attributes help users to understand where things happen and why. For example, GIS or other specialized software applications might generate or use attributes to access, visualize or manipulate a geographical feature or to conduct spatial analysis.
Temporal spatial data is data that's associated with a specific time (or time range). The data might be vector point data (e.g., a GPS tracking point) or raster imagery data (e.g., a satellite image capture).
Geospatial analysis: Georeferencing and geocoding
Two main processes are used in geospatial analysis, both of which involve fitting geospatial data into the real world by using appropriate coordinates. That said, there are differences between the processes.
Georeferencing is about assigning data coordinates to vectors or rasters. This approach helps to orient the vector or raster on a model of the Earth's surface, which then helps to create an accurate model of the surface.
Geocoding provides address and location descriptors about cities, states, countries and so on. Each location has an exact and unique coordinate, and no two locations can have the same coordinate.
What is spatial data science?
Spatial data science is the science of extracting insights from data by leveraging a comprehensive set of spatial algorithms and analytical methods. Often, machine learning algorithms and deep learning networks are used to identify hidden patterns within the data to create or improve predictive models for a range of applications, including data-driven decision-making in governments and enterprises.
Spatial data mining and data visualization are two key aspects of spatial data science:
Spatial data mining is the process of discovering hidden patterns in large spatial datasets. It is a key driver of GIS application development, since it allows users to extract valuable data on contiguous regions, such as distance and direction, and investigate spatial patterns for further analysis, action, or decision-making.
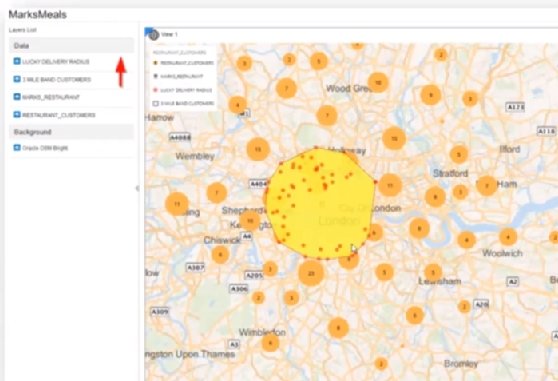
Data visualization software, such as Tableau, allows data scientists and marketers to connect different spatial data files like Esri File Geodatabases, GeoJSON files, Keyhole Markup Language (KML) files, MapInfo tables, shapefiles and TopoJSON files. Data visualization software users can then create points, lines and polygon maps for various applications.

Applications of spatial data
Spatial data is used in numerous real-world situations, such as land-use planning and soil science. It is also used in flow-direction studies and infrastructural project management.
Some other applications of spatial data are:
- Hydrology. To study water movements, distribution and availability.
- Cartography. To create topographic and relief maps.
- Forestry management. For tree inspections, to create models of forest ecosystems and to prepare inventories of forest resources.
- Aviation planning and management. For flight planning and airport management, and to track aircraft and optimize the usage of airspace.
- Urban planning. To create zones (commercial, industrial, residential, etc.), to determine where public facilities (parks, hospitals, etc.) should be placed and to determine routes for public utilities and transportation.
- Disaster management and response. To identify where a disaster occurred and to plan for resources and provide relief; to track at-risk areas and predict natural disasters by using in combination with historical data, weather data and geospatial data.
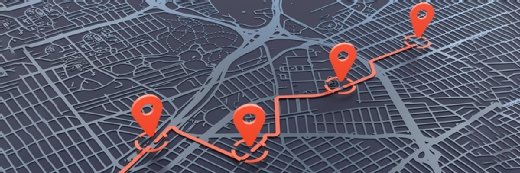
- Transportation management systems and logistics. In TMS and logistics, to create routes, make accurate time estimations for deliveries and track deliveries in real time.
Spatial data is also collected and analyzed for scientific research, public policy-making and historical, cultural or anthropological studies, and to enable innovations and improvements in healthcare (e.g., disease tracking), business (e.g., supply chain optimization) and technology (e.g., real-time navigation and augmented reality).
Spatial data is important for the internet of things (IoT). IoT protocols use remote sensing to collect data for spatial analysis. Environmental technologies also use spatial data to monitor temperature patterns, tidal patterns and more.
Geospatial analytics provides insights that help organizations analyze current situations and use historical data to predict future outcomes. Learn how geospatial analytics can bolster predictive capabilities.