Ultimate guide to business intelligence in the enterprise
Enterprise BI systems bring a variety of uses, business benefits and challenges to organizations, as explained in this in-depth business intelligence guide.

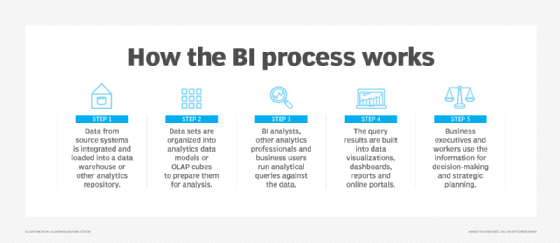
In the past, business decisions were often based on prior experience, accumulated knowledge or intuition. But business intelligence tools have replaced management by gut feeling with data-driven decision-making. BI combines data analysis, data visualization and reporting capabilities to uncover actionable information and deliver it to executives, managers and other business users.
Enterprise business intelligence helps guide both operational decision-making and strategic planning in an organization. BI applications generate insights on business performance, processes and trends, enabling management teams to identify problems and new opportunities and then take action to address them. That can result in more efficient and productive business operations, more effective marketing, competitive advantages over industry rivals and, ultimately, higher revenue and profits.
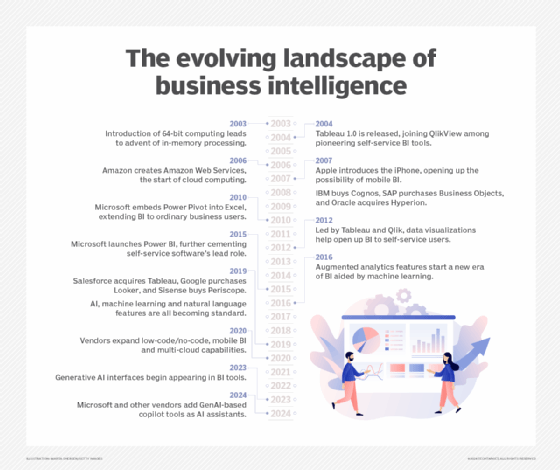
BI software emerged in the early 1990s and is widely used in enterprises, both large and small. The development of self-service BI tools and, more recently, augmented analytics features based on AI and machine learning technologies has improved the software's ease of use, allowing business analysts and managers to analyze data themselves instead of relying on BI professionals to run queries for them.
But BI and data management teams still face a variety of challenges in deploying, managing and supporting BI systems, from getting BI programs approved and funded to integrating data sets for analysis, selecting BI software, training users and keeping self-service BI implementations in different business units from devolving into chaotic environments that produce inconsistent analytics results.
This wide-ranging guide to business intelligence in the enterprise provides insight and advice on how to successfully manage BI projects. You'll learn about common BI use cases, key functions of BI tools, the different components of BI systems and the BI deployment process; you'll also get more details on BI's business benefits and the challenges it poses. Throughout the guide, you'll find hyperlinks to related TechTarget articles that delve more deeply into the topics being discussed.
How industries use BI tools
In its 2020 Magic Quadrant report on analytics and BI platforms, consulting and market research firm Gartner said the number of people using them in organizations "is accelerating massively." In addition to self-service BI and augmented analytics capabilities, the report cited lower software costs as a big reason for the increased usage. The per-user price of BI tools "is a fraction of what it was a decade ago," Gartner said, pointing to factors such as more competition among BI vendors and the shift to the cloud.
Embedded BI deployments are another contributor to the growing adoption, according to Gartner, which said they often reach beyond internal users to include customers, suppliers and other business partners. Such deployments embed BI software in ERP, CRM and other business applications so end users can do data analytics within their usual workspace, without having to switch to a separate tool.
Overall, examples of how business intelligence is used in different industries include the following:
- Banks use BI to help assess financial risks in deciding whether to approve mortgage and loan applications. They and other financial services firms also analyze customer portfolios to help plan cross-selling efforts aimed at getting customers to buy additional products.
- Insurers similarly rely on BI tools to analyze risks when considering applications for life, auto and homeowners insurance policies. In addition, they tap BI to analyze policy pricing.
- Manufacturers use BI software to aid in production planning, procurement of materials and supplies, supply chain management and monitoring of manufacturing operations.
- Retailers plan marketing campaigns and product promotions with the aid of BI and analytics tools, while also using them in inventory management and product replenishment.
- Hotel chains use BI tools to track room occupancy rates and adjust pricing based on booking demand, and to help manage customer loyalty programs.
- Airlines likewise employ BI to help track ticket sales and flight occupancy, and for things such as managing flight schedules, crew assignments and food and beverage ordering.
- Transportation companies plan distribution schedules and routes with guidance from BI and analytics tools. They also use BI to monitor gas mileage and other aspects of fleet operations.
- Hospitals use BI systems to analyze patient outcomes and readmission rates as part of efforts to improve patient care. In addition, doctors use the tools to analyze clinical data and help diagnose medical conditions.
Key functions of BI platforms
BI tools evolved from earlier decision-support systems that were developed starting in the 1960s. Those systems were designed primarily to funnel information to senior business executives -- in fact, one product category was known as executive information systems. In contrast, modern BI platforms have broader functions and user bases that extend from C-suite executives to department heads, middle managers, business analysts and frontline operational workers.
These are the major business intelligence functions that are now prevalent in the enterprise:
Business monitoring and measurement. BI systems are widely used to track KPIs and other business metrics so executives and business managers can monitor the performance of an organization as a whole or individual business units on an ongoing basis. That helps them identify and address business problems in a more proactive way than they could in the past, when performance reports were less timely. For example, a BI tool could show that product sales were below plan in one region, enabling sales managers to take steps to boost them in time to meet the quarterly goal.
Data analysis. Beyond just tracking metrics, BI tools support more involved analytics via ad hoc querying of data sets. Business users and BI analysts run queries to analyze data for business insights that can be used to optimize business processes, marketing campaigns, corporate strategies and other enterprise elements. Querying and analysis also highlights business trends, allowing executives to explore ways to capitalize on new revenue opportunities that otherwise might be missed. This BI function is the linchpin of data-driven decision-making processes in organizations.
Reporting and information delivery. BI results must be distributed or made available to business users so they can put the information to use. Initially, that was primarily done via static reports, often sent out in printed form. Reports are still widely used, but BI dashboards have become increasingly popular. They offer a more visual and interactive interface with built-in data visualizations and the ability to drill down into the underlying data for more analysis. See examples of 12 types of data visualizations that can be used in dashboards, reports and online portals, another BI information delivery option.
Predictive analysis. Conventional BI is a form of descriptive analytics. By analyzing historical data or real-time data streams, it examines things that have already happened or are happening now so an enterprise can respond as needed. On the other hand, predictive analytics forecasts future events, such as how customers will react to marketing offers. It's a type of advanced analytics usually done by data scientists, but BI tools can be used to run predictive models and what-if analysis queries on the outcomes of different business scenarios, adding a predictive element to the BI process.
Components of enterprise BI environments
Reflecting current BI trends, Gartner has characterized modern BI platforms as easy-to-use systems that support the complete analytics process, from data preparation to visual data exploration and insight generation, with an emphasis on user self-service and augmented analytics. In its 2020 Magic Quadrant report, the firm listed 15 core capabilities that such platforms should include, ranging from security, manageability and data source connectivity to data visualization, reporting and data storytelling.
But there's more to business intelligence environments than the BI tools themselves. For example, a typical BI architecture also incorporates internal source systems and external data sources; data warehouses and other data repositories; and a variety of data processing and data management tools.
Here are more details on the core BI components for enterprise users:
BI and analytics tools. In addition to self-service querying, visualization and reporting, the augmented analytics features now being built into BI platforms include natural language querying support and AI-driven technologies that help users find and understand data, prepare it for analysis and create visualizations. Organizations can also deploy other types of tools for particular BI uses -- such as data mining software, real-time analytics systems and online analytical processing, known as OLAP for short, engines that store data in multidimensional cubes to support sophisticated analysis and calculations.
Dashboards and reports. Penny Wand, a technology practice director at business and IT consultancy West Monroe Partners, told technology writer George Lawton that BI and analytics "is only powerful if it drives action." Dashboards in particular are an effective way to distribute BI information to business users to help drive decision-making and strategic planning. Get tips on designing good dashboards from Wand and other experts in an article by Lawton.
Data sources. These primarily include an organization's transaction processing and operational systems, such as ERP, CRM, finance, HR and supply chain management applications. Market data, outside customer lists and other external data sets can also be collected in BI systems for analysis.
Data stores. Data from source systems is generally consolidated and loaded into a data warehouse, where it can be accessed for BI uses. Smaller data marts are also often deployed for individual departments. In addition, a BI architecture may include an operational data store as a staging area for data before it goes to the data warehouse, as well as a data lake that holds sets of big data -- often in unstructured or semistructured formats as opposed to the structured data found in the warehouse.
Data integration and data quality software. ETL tools -- short for extract, transform and load -- are the primary means of integrating data for BI uses; they pull together data in batch processes. Other integration methods that can be employed include real-time data integration and data virtualization, which creates blended views of data sets without physically loading them into a data warehouse. Data profiling and cleansing typically are done in conjunction with integration to identify and fix data errors.
Data optimization, preparation and curation tools. BI and data management teams can also deploy software to help automate data preparation and the process of curating data sets for BI users to streamline and focus their analytics work. Metadata repositories, business glossaries and data catalogs are other technologies that can help users find relevant data sets for BI applications.
BI's business and organizational benefits
In an article on BI use cases and benefits by technology writer Mary K. Pratt, Constellation Research analyst Doug Henschen described BI and analytics as "effectively the eyes and ears of the organization." Successfully running a company without solid business intelligence and reporting is nearly impossible, Henschen noted. "It's not a nice-to-have -- it's a must-have."
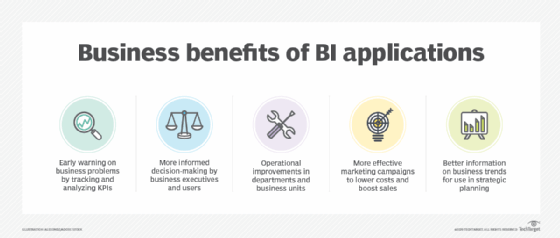
Pratt listed in her article these potential business benefits from BI programs, based on input from Henschen, BI practitioners and other industry analysts and consultants:
- identifying business issues that need to be addressed;
- enabling faster and more informed decision-making;
- increasing operational efficiency and productivity;
- improving marketing and sales programs; and
- aiding strategic planning by business executives.
That corresponds to survey results published by research firm Dresner Advisory Services in its 2020 "Wisdom of Crowds Business Intelligence Market Study" report. Better decision-making and more efficient operations were the top two "BI achievements" cited by the IT, BI and business professionals who responded to the survey, according to the report. Those benefits were followed by gaining competitive advantages, enhancing customer service and increasing revenue, Dresner said.
Organizational challenges of BI
On the other hand, one of the dangers of BI applications is that the accelerated decision-making they enable could lead organizations astray if it's based on faulty or incomplete data and inaccurate analytics results. In an article by George Lawton on the BI challenges faced by enterprises, Porter Thorndike, senior director of strategic services at software vendor Information Builders, cautioned: "Is the speed at which those insights are generated worth acting upon knowing that some of the insights could be faulty?"
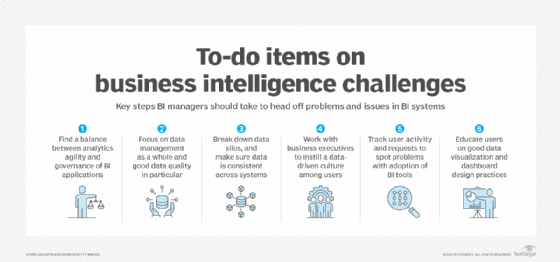
The challenges detailed in the story include several data management issues: integrating data from different systems, ensuring data quality and breaking down data silos so business users have access to data that's clean, consistent and complete. Other top challenges involve BI project management: training users, meeting their data and analytics requirements, managing self-service BI deployments and avoiding bad data visualization and dashboard design practices.
User adoption issues are another potential business intelligence roadblock. They can result from business users being reluctant to give up Excel spreadsheets or other familiar tools and switch to BI software. In addition, creating a data-driven culture remains an ongoing challenge in many organizations -- "not just at the executive level, but at the front lines, where the business truly interacts with the world around it," said Sudheesh Nair, CEO of BI and analytics software vendor ThoughtSpot.
How to implement a BI program
Donald Farmer, principal of analytics consultancy TreeHive Strategy, wrote in an article for TechTarget that all businesses are already doing BI to some degree. In many cases, though, that consists of using spreadsheets or business applications and mobile apps with basic built-in reporting capabilities -- technologies that "are essential tactical tools, but not strategic," he said.
The steps listed below outline how to create and implement a formal business intelligence program that takes data analysis to a more strategic level within an organization.
- Get management approval for the BI program. You'll need approval and funding from corporate executives to staff a BI team and purchase BI tools and the hardware and additional software that's required. To help sell the program, you should document business requirements, potential BI use cases and expected benefits, with ROI calculations included.
- Develop your business intelligence strategy. In his article on creating an enterprise BI strategy, Farmer said it should build "on a vision of what success looks like: an understanding of competitive advantage and how to deliver that." He recommended starting with an audit of existing analytics tools and a survey of business executives and workers about their use of data. You should then consider data privacy protections, governance, how to support self-service BI users, technology needs, KPIs to track and other issues, he said.
- Set up and staff the BI team. Business intelligence teams in large enterprises typically include a variety of BI roles and responsibilities, from a BI director or program manager to positions such as BI architect, BI developer and BI analyst. Each requires a different blend of BI and data management skills, plus common ones that include an aptitude for data analysis and communication, collaboration and problem-solving abilities. However, some of those roles may have to be combined into one position in smaller companies with limited budgets and resources. Both new and experienced BI professionals should continue to develop their knowledge and skills through various educational resources, including books on BI and analytics topics.
- Design the business intelligence architecture. Plan out the hardware and software components of your BI architecture and how data will flow through it from the original source systems to a data warehouse or data mart and then to BI tools. You'll also need to decide whether to deploy the environment on premises or in the cloud; most new spending on BI platforms is now for cloud deployments, Gartner said. An emerging architectural option is adopting a DataOps approach, which uses Agile development and DevOps-style processes to streamline the creation of data pipelines for BI and analytics uses.
- Select BI and data visualization software. The software selection process for BI tools should involve business users and ensure that the chosen software meets their business needs. That could mean purchasing multiple tools for different BI applications or separate business units in self-service BI environments.
- Plan and conduct end-user training. Training is a crucial element of business intelligence initiatives, both to familiarize business users with BI tools and processes and to make sure they're aware of governance, privacy and security policies.
- Deploy and test the BI system. Before going live with the BI applications, test the environment to make sure things work as planned. That includes the BI tools themselves, plus all of the data processing and management components.