business intelligence (BI)
What is business intelligence?
Business intelligence (BI) is a technology-driven process for analyzing data and delivering actionable information that helps executives, managers and workers make informed business decisions. As part of the BI process, organizations collect data from internal IT systems and external sources, prepare it for analysis, run queries against the data and create data visualizations, BI dashboards and reports to make the analytics results available to business users for operational decision-making and strategic planning.
The ultimate goal of BI initiatives is to drive better business decisions that enable organizations to increase revenue, improve operational efficiency and gain competitive advantages over business rivals. To achieve that goal, BI incorporates a combination of analytics, data management and reporting tools, plus various methodologies for managing and analyzing data.
How does the business intelligence process work?
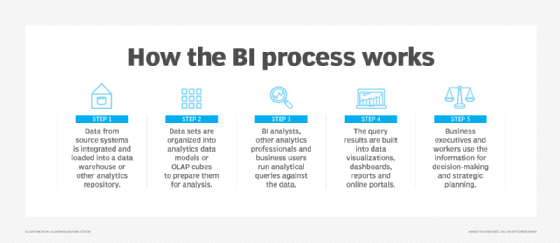
A business intelligence architecture includes more than just BI software. Business intelligence data is typically stored in a data warehouse built for an entire organization or in smaller data marts that hold subsets of business information for individual departments and business units, often with ties to an enterprise data warehouse. In addition, data lakes based on Hadoop clusters or other big data systems are increasingly used as repositories or landing pads for BI and analytics data, especially for log files, sensor data, text and other types of unstructured or semistructured data.
BI data can include historical information and real-time data gathered from source systems as it's generated, enabling BI tools to support both strategic and tactical decision-making processes. Before it's used in BI applications, raw data from different source systems generally must be integrated, consolidated and cleansed using data integration and data quality management tools to ensure that BI teams and business users are analyzing accurate and consistent information.
This article is part of
Ultimate guide to business intelligence in the enterprise
From there, the steps in the BI process include the following:
- data preparation, in which data sets are organized and modeled for analysis;
- analytical querying of the prepared data;
- distribution of key performance indicators (KPIs) and other findings to business users; and
- use of the information to help influence and drive business decisions.
Initially, BI tools were primarily used by BI and IT professionals who ran queries and produced dashboards and reports for business users. Increasingly, however, business analysts, executives and workers are using business intelligence platforms themselves, thanks to the development of self-service BI and data discovery tools. Self-service business intelligence environments enable business users to query BI data, create data visualizations and design dashboards on their own.
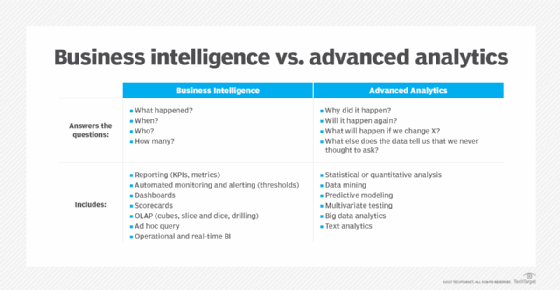
BI programs often incorporate forms of advanced analytics, such as data mining, predictive analytics, text mining, statistical analysis and big data analytics. A common example is predictive modeling that enables what-if analysis of different business scenarios. In most cases, though, advanced analytics projects are conducted by separate teams of data scientists, statisticians, predictive modelers and other skilled analytics professionals, while BI teams oversee more straightforward querying and analysis of business data.
Why business intelligence is important
Overall, the role of business intelligence is to improve an organization's business operations through the use of relevant data. Companies that effectively employ BI tools and techniques can translate their collected data into valuable insights about their business processes and strategies. Such insights can then be used to make better business decisions that increase productivity and revenue, leading to accelerated business growth and higher profits.
Without BI, organizations can't readily take advantage of data-driven decision-making. Instead, executives and workers are primarily left to base important business decisions on other factors, such as accumulated knowledge, previous experiences, intuition and gut feelings. While those methods can result in good decisions, they're also fraught with the potential for errors and missteps because of the lack of data underpinning them.
Benefits of business intelligence
A successful BI program produces a variety of business benefits in an organization. For example, BI enables C-suite executives and department managers to monitor business performance on an ongoing basis so they can act quickly when issues or opportunities arise. Analyzing customer data helps make marketing, sales and customer service efforts more effective. Supply chain, manufacturing and distribution bottlenecks can be detected before they cause financial harm. HR managers are better able to monitor employee productivity, labor costs and other workforce data.
Overall, the key benefits that businesses can get from BI applications include the ability to:
- speed up and improve decision-making;
- optimize internal business processes;
- increase operational efficiency and productivity;
- spot business problems that need to be addressed;
- identify emerging business and market trends;
- develop stronger business strategies;
- drive higher sales and new revenues; and
- gain a competitive edge over rival companies.
BI initiatives also provide narrower business benefits -- among them, making it easier for project managers to track the status of business projects and for organizations to gather competitive intelligence on their rivals. In addition, BI, data management and IT teams themselves benefit from business intelligence, using it to analyze various aspects of technology and analytics operations.
Types of business intelligence tools and applications
Business intelligence combines a broad set of data analysis applications designed to meet different information needs. Most are supported by both self-service BI software and traditional BI platforms. The list of BI technologies that are available to organizations includes the following:
Ad hoc analysis. Also known as ad hoc querying, this is one of the foundational elements of modern BI applications and a key feature of self-service BI tools. It's the process of writing and running queries to analyze specific business issues. While ad hoc queries are typically created on the fly, they often end up being run regularly, with the analytics results incorporated into dashboards and reports.
Online analytical processing (OLAP). One of the early BI technologies, OLAP tools enable users to analyze data along multiple dimensions, which is particularly suited to complex queries and calculations. In the past, the data had to be extracted from a data warehouse and stored in multidimensional OLAP cubes, but it's increasingly possible to run OLAP analyses directly against columnar databases.
Mobile BI. Mobile business intelligence makes BI applications and dashboards available on smartphones and tablets. Often used more to view data than to analyze it, mobile BI tools typically are designed with an emphasis on ease of use. For example, mobile dashboards may only display two or three data visualizations and KPIs so they can easily be viewed on a device's screen.
Real-time BI. In real-time BI applications, data is analyzed as it's created, collected and processed to give users an up-to-date view of business operations, customer behavior, financial markets and other areas of interest. The real-time analytics process often involves streaming data and supports decision analytics uses, such as credit scoring, stock trading and targeted promotional offers.
Operational intelligence (OI). Also called operational BI, this is a form of real-time analytics that delivers information to managers and frontline workers in business operations. OI applications are designed to aid in operational decision-making and enable faster action on issues -- for example, helping call center agents to resolve problems for customers and logistics managers to ease distribution bottlenecks.
Software-as-a-service BI. SaaS BI tools use cloud computing systems hosted by vendors to deliver data analysis capabilities to users in the form of a service that's typically priced on a subscription basis. Also known as cloud BI, the SaaS option increasingly offers multi-cloud support, which enables organizations to deploy BI applications on different cloud platforms to meet user needs and avoid vendor lock-in.
Open source BI (OSBI). Business intelligence software that is open source typically includes two versions: a community edition that can be used free of charge and a subscription-based commercial release with technical support by the vendor. BI teams can also access the source code for development uses. In addition, some vendors of proprietary BI tools offer free editions, primarily for individual users.
Embedded BI. Embedded business intelligence tools put BI and data visualization functionality directly into business applications. That enables business users to analyze data within the applications they use to do their job. Embedded analytics features are most commonly incorporated by application software vendors, but corporate software developers can also include them in homegrown applications.
Collaborative BI. This is more of a process than a specific technology. It involves the combination of BI applications and collaboration tools to enable different users to work together on data analysis and share information with one another. For example, users can annotate BI data and analytics results with comments, questions and highlighting via the use of online chat and discussion tools.
Location intelligence (LI). This is a specialized form of BI that enables users to analyze location and geospatial data, with map-based data visualization functionality incorporated. Location intelligence offers insights on geographic elements in business data and operations. Potential uses include site selection for retail stores and corporate facilities, location-based marketing and logistics management.
Business intelligence vendors and market
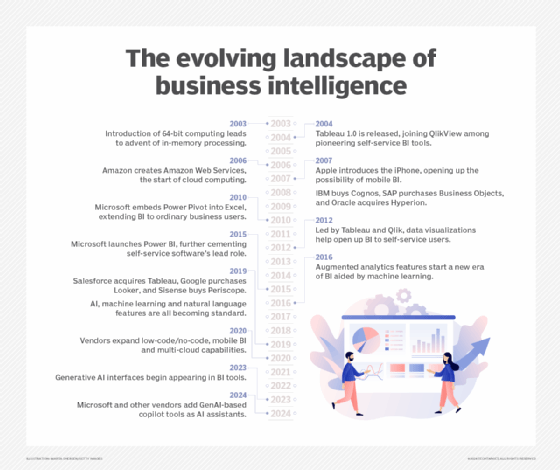
Self-service BI and data visualization tools have become the standard for modern BI software. Tableau, Qlik and Spotfire, which is now part of Tibco Software, took the lead in developing self-service technology early and became prominent competitors in the BI market by 2010. Most vendors of traditional BI query and reporting tools have followed in their path since then. Now, virtually every major BI tool incorporates self-service features, such as visual data discovery and ad hoc querying.
In addition, modern BI platforms typically include:
- data visualization software for designing charts and other infographics to show data in an easy-to-grasp way;
- tools for building BI dashboards, reports and performance scorecards that display visualized data on KPIs and other business metrics;
- data storytelling features for combining visualizations and text in presentations for business users; and
- usage monitoring, performance optimization, security controls and other functions for managing BI deployments.
BI tools are available from dozens of vendors overall. Major IT vendors that offer BI software include IBM, Microsoft, Oracle, SAP, SAS and Salesforce, which bought Tableau in 2019 and also sells its own tools developed before the acquisition. Google is also in the BI market through its Looker unit, acquired in 2020. Other notable BI vendors include Alteryx, Domo, GoodData, Infor Birst, Information Builders, Logi Analytics, MicroStrategy, Pyramid Analytics, Sisense, ThoughtSpot and Yellowfin.
While full-featured BI platforms are the most widely used business intelligence technology, the BI market also includes other product categories. Some vendors offer tools specifically for embedded BI uses; examples include GoodData and Logi Analytics. Companies like Looker, Sisense and ThoughtSpot target complex and curated data analysis applications. Various dashboard and data visualization specialists focus on those parts of the BI process; other vendors specialize in data storytelling tools.
What are some examples of business intelligence use cases?
In general terms, enterprise BI use cases include:
- monitoring business performance or other types of metrics;
- supporting decision-making and strategic planning;
- evaluating and improving business processes;
- giving operational workers useful information about customers, equipment, supply chains and other elements of business operations; and
- detecting trends, patterns and relationships in data.
Specific use cases and BI applications vary from industry to industry. For example, financial services firms and insurers use BI for risk analysis during the loan and policy approval processes and to identify additional products to offer to existing customers based on their current portfolios. BI helps retailers with marketing campaign management, promotional planning and inventory management, while manufacturers rely on BI for both historical and real-time analysis of plant operations and to help them manage production planning, procurement and distribution.
Airlines and hotel chains are big users of BI for things such as tracking flight capacity and room occupancy rates, setting and adjusting prices, and scheduling workers. In healthcare organizations, BI and analytics aid in the diagnosis of diseases and other medical conditions and in efforts to improve patient care and outcomes. Universities and school systems tap BI to monitor overall student performance metrics and identify individuals who might need assistance, among other applications.
Business intelligence for big data
BI platforms are increasingly being used as front-end interfaces for big data systems that contain a combination of structured, unstructured and semistructured data. Modern BI software typically offers flexible connectivity options, enabling it to connect to a range of data sources. This, along with the relatively simple user interface (UI) in most BI tools, makes it a good fit for big data architectures.
Users of BI tools can access Hadoop and Spark systems, NoSQL databases and other big data platforms, in addition to conventional data warehouses, and get a unified view of the diverse data stored in them. That enables a broad number of potential users to get involved in analyzing sets of big data, instead of highly skilled data scientists being the only ones with visibility into the data.
Alternatively, big data systems serve as staging areas for raw data that later is filtered and refined and then loaded into a data warehouse for analysis by BI users.
Business intelligence trends
In addition to BI managers, business intelligence teams generally include a mix of BI architects, BI developers, BI analysts and BI specialists who work closely with data architects, data engineers and other data management professionals. Business analysts and other end users are also often included in the BI development process to represent the business side and make sure its needs are met.
To help with that, a growing number of organizations are replacing traditional waterfall development with Agile BI and data warehousing approaches that use Agile software development techniques to break up BI projects into small chunks and deliver new functionality on an incremental and iterative basis. Doing so enables companies to put BI features into use more quickly and to refine or modify development plans as business needs change or new requirements emerge.
Other notable trends in the BI market include the following:
- The proliferation of augmented analytics technologies. BI tools increasingly offer natural language querying capabilities as an alternative to writing queries in SQL or another programming language, plus AI and machine learning algorithms that help users find, understand and prepare data and create charts and other infographics.
- Low-code and no-code development. Many BI vendors are also adding graphical tools that enable BI applications to be developed with little or no coding.
- Increased use of the cloud. BI systems initially were slow to move to the cloud, partly because data warehouses were primarily deployed in on-premises data centers. But cloud deployments of both data warehouses and BI tools are growing; in early 2020, consulting firm Gartner said most new BI spending is now for cloud-based projects.
- Efforts to improve data literacy. With self-service BI broadening the use of business intelligence tools in organizations, it's critical to ensure that new users can understand and work with data. That's prompting BI teams to include data literacy skills in user training programs. BI vendors have also launched initiatives, such as the Qlik-led Data Literacy Project.
Business intelligence vs. data analytics and business analytics
Sporadic use of the term business intelligence dates back to at least the 1860s, but consultant Howard Dresner is credited with first proposing it in 1989 as an umbrella phrase for applying data analysis techniques to support business decision-making processes. What came to be known as BI tools evolved from earlier, often mainframe-based analytics technologies, such as decision support systems and executive information systems that were primarily used by business executives.
Business intelligence is sometimes used interchangeably with business analytics. In other cases, business analytics is used either more narrowly to refer to advanced analytics or more broadly to include both that and BI. Meanwhile, data analytics is primarily an umbrella term that encompasses all forms of BI and analytics applications. That includes the main types of data analysis: descriptive analytics, which is typically what BI provides; predictive analytics, which models future behavior and outcomes; and prescriptive analytics, which recommends business actions.